By Paul Craine - researcher, author and Climate Leader
Earlier this month the Met Office at Ronaldsway confirmed that 2023 was the warmest year ever recorded in the Isle of Man. Before this, the warmest year was 2022. Although in the UK, last year was not the warmest recorded, it was the hottest year ever recorded globally.
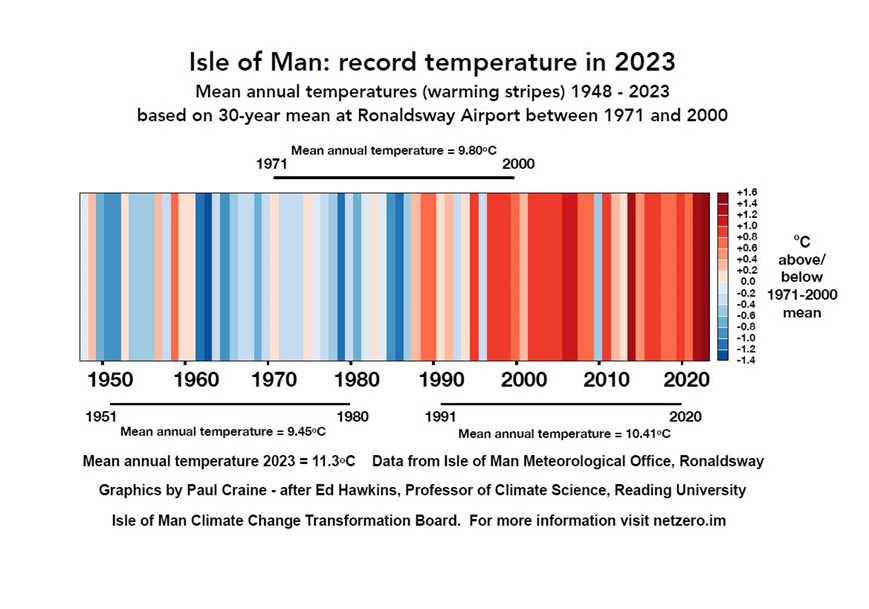
The stripes show how annual temperatures have changed in the Isle of Man since the Met Office opened in 1947 - 76 years ago! The image was made renowned by Professor Ed Hawkins, climate scientist in the National Centre for Atmospheric Science at the University of Reading.
From the left to the right, the image shows how temperatures recorded in the Isle of Man have risen. Data from the Island’s Met Office clearly show the warming that has been taking place here. Climate warming stripes showing this trend have emerged from weather stations around the world - no part of the globe is immune from the effects of global warming.

Isle of Man Climate Stripes by Paul Craine
These graphics are specifically designed to be as simple as possible, and to start conversations about our warming world and the risks of climate change.
showyourstripes.info
What data sits behind the coloured stripes? The mean annual (average) temperature is based on recordings made every day of the year. It starts with the mean of the temperatures taken each day. These are then used to calculate the mean temperature for each month. Finally the average of the mean monthly temperatures is calculated.
The image uses the mean annual temperature from 1971 - 2000 (climate data is usually based on a 30-year average). Those years recorded an average of 9.80oC. The coloured stripes show how each year compared with that average. Some years, shaded blue, had a mean temperature below the average. Other years, shaded red, had a mean temperature above average. The scale is shown to the right of the graph.
Shades of blue indicate cooler-than-average years, while red shows years that were hotter than average.
University of Reading, 2024
The darker the blue, the colder the year. We can see that the coldest year since the records began was 1963 (8.49oC) when the mean annual temperature was more than 1.3oC lower than the 1971-2000 average. From the 1950s to the 1980s it was normal for the annual temperatures to be below the 1971-2000 average. 30 of these years were colder than average!
The darker the red stripes, the warmer the year. 2023 stands out as it is the only year shaded darkest red with temperatures more than 1.4oC above the average. Since 1990 there have been just three years with annual temperatures below the 1971-2000 average.
The stark band of deep red stripes on the right-hand side of the graphic show the rapid heating of our planet in recent decades.
University of Reading, 2024
The stripes are already having an impact. More than a million people downloaded graphics from the Show Your Stripes website within a week of its launch in 2019.
Television weather presenters, scientists and campaigners worldwide continue to wear and share them on social media – using the hashtag #showyourstripes – each June on the summer/winter solstice. The stripes have appeared on the Main Stage at Reading Festival, projected on major landmarks, used at school climate strikes, and on electric cars, trams and trains. Even on Reading FC kits! [1]
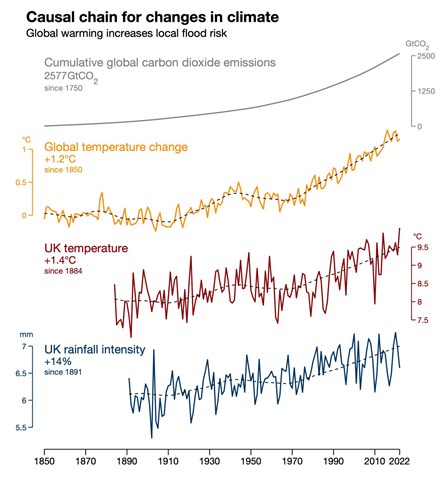
Trends in climate change and the impacts of human activity on our planet can be seen in many visual ways and graphs. Many show the link between the rise in emissions, warmer temperatures, more intense and frequent rainfall and the loss of arctic sea ice. See Ed Hawkin's Climate Visuals and recently published 2023 charts by the BBC.

Ed Hawkin's Climate Visuals
Find out more about the impacts of our changing climate here on the Isle of Man.
